Logitech has just released a comprehensive new report detailing how organizations can finally find deeper insight into their office performance.
For leaders seeking true enterprise workspace optimization, moving beyond basic badge swipes is now a critical requirement. The newly published guide emphasizes that upgrading workplace data analytics is a fundamental operational necessity today.
By focusing on precise office space utilization metrics, decision makers can maximize the true potential of their real estate.
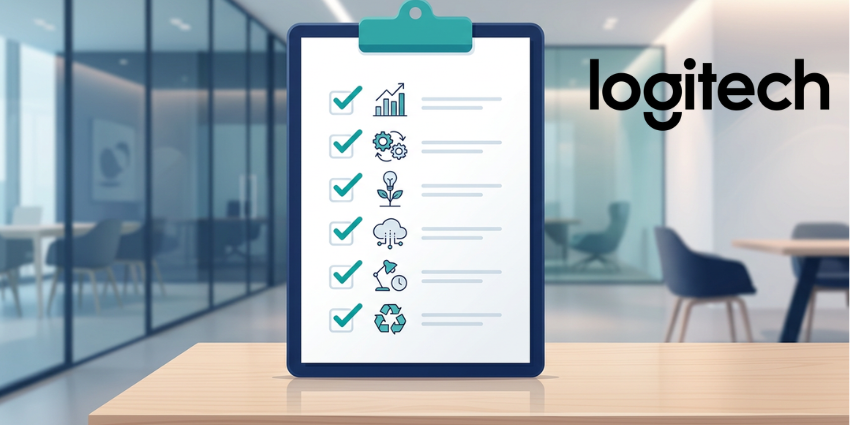
The Logitech report specifically outlines six essential data points that transform workplace management, and we've outlined how these metrics correlate to productivity and business success.
Related Articles:
- How Companies Are Correcting Their Office Downsizing “Overshoot”
- Why Tech Sector Real Estate Strategy Needs an Operational Upgrade
- Return-to-Office’s Hidden Cost: Accommodation Litigation Hits Three-Year High
1. Utilization Rate: Revealing True Office Demand
What It Is: Utilization rates measure how often desks and meeting rooms are actually used compared to when they are technically available. It moves beyond simple attendance to show the true daily demand for specific spaces across the entire office.
How It Is Collected and Analyzed: Facilities teams collect this data using smart sensors and AI-powered cameras, such as the Logitech Rally Bar family. These devices detect presence continuously, feeding data into centralized platforms. Leaders can then analyze this information to spot overutilized zones and completely abandoned areas.
What It Means for Productivity: Analyzing these metrics helps organizations identify which areas sit empty and which see constant use. This visibility allows leaders to repurpose dead zones into highly productive collaboration hubs. Effective workspace optimization relies entirely on understanding these baseline usage patterns to reduce daily employee friction.
2. Meeting Size & Attendance: Right-Sizing Collaboration
What It Is: This metric tracks the actual number of participants in meetings and compares that figure directly to the room's intended capacity. It highlights the frequent mismatch between how spaces are designed and how teams actually gather.
How It Is Collected and Analyzed: Modern video conferencing hardware, equipped with people-counting capabilities, captures this information anonymously during active sessions. Modern devices can monitor headcounts and send the data directly to management dashboards. Teams analyze this data stream to identify if large boardrooms are constantly being booked for two-person calls.
What It Means for Productivity: This specific data prevents companies from wasting valuable square footage on oversized rooms that rarely reach full capacity. When businesses right-size their spaces, employees spend less time searching for appropriate meeting areas. Better room alignment directly reduces daily friction and supports smoother operational workflows across the board.
3. Room Occupancy Patterns: Understanding Behavioral Trends
What It Is: Room occupancy patterns reveal which specific spaces are used most often and how usage varies across different room types. It provides a detailed look at employee preferences, showing whether teams favor casual huddle spaces or formal conference environments.
How It Is Collected and Analyzed: Integrated scheduling software, digital maps, and motion sensors work together to track these behavioral trends over time. Platforms like Logitech View and Tap Scheduler monitor real-time availability while logging historical usage. Decision makers review these metrics to see exactly how physical layouts perform under real-world conditions.
What It Means for Productivity: By understanding these patterns, leaders can adjust floor plans to match actual work habits seamlessly. This proactive approach ensures that physical layouts evolve alongside changing workforce preferences. When spaces match how people actually want to work, overall team output increases significantly.
Join the conversation and follow UC Today on LinkedIn for the latest enterprise technology insights.
4. Peak Usage Times: Managing Demand Spikes
What It Is: Peak usage times identify exactly when demand for desks and meeting rooms hits its highest point throughout the day or week. It highlights the artificial busy days that often overwhelm existing office resources and infrastructure.
How It Is Collected and Analyzed: Facilities managers gather this intelligence by analyzing historical booking data alongside real-time sensor inputs. Management platforms track these surges, allowing teams to see exactly when the office reaches maximum capacity. Advanced analytics allow companies to predict these spikes before they cause major operational disruptions.